
Open the detailed view.
Open Activity Monitor from Applications → Utilities, or find it with Spotlight. Select CPU and sort the process list by % CPU to see which processes are busy. Compare the reading with the task you are running, such as exporting a video or compiling an app.
Read CPU over time.
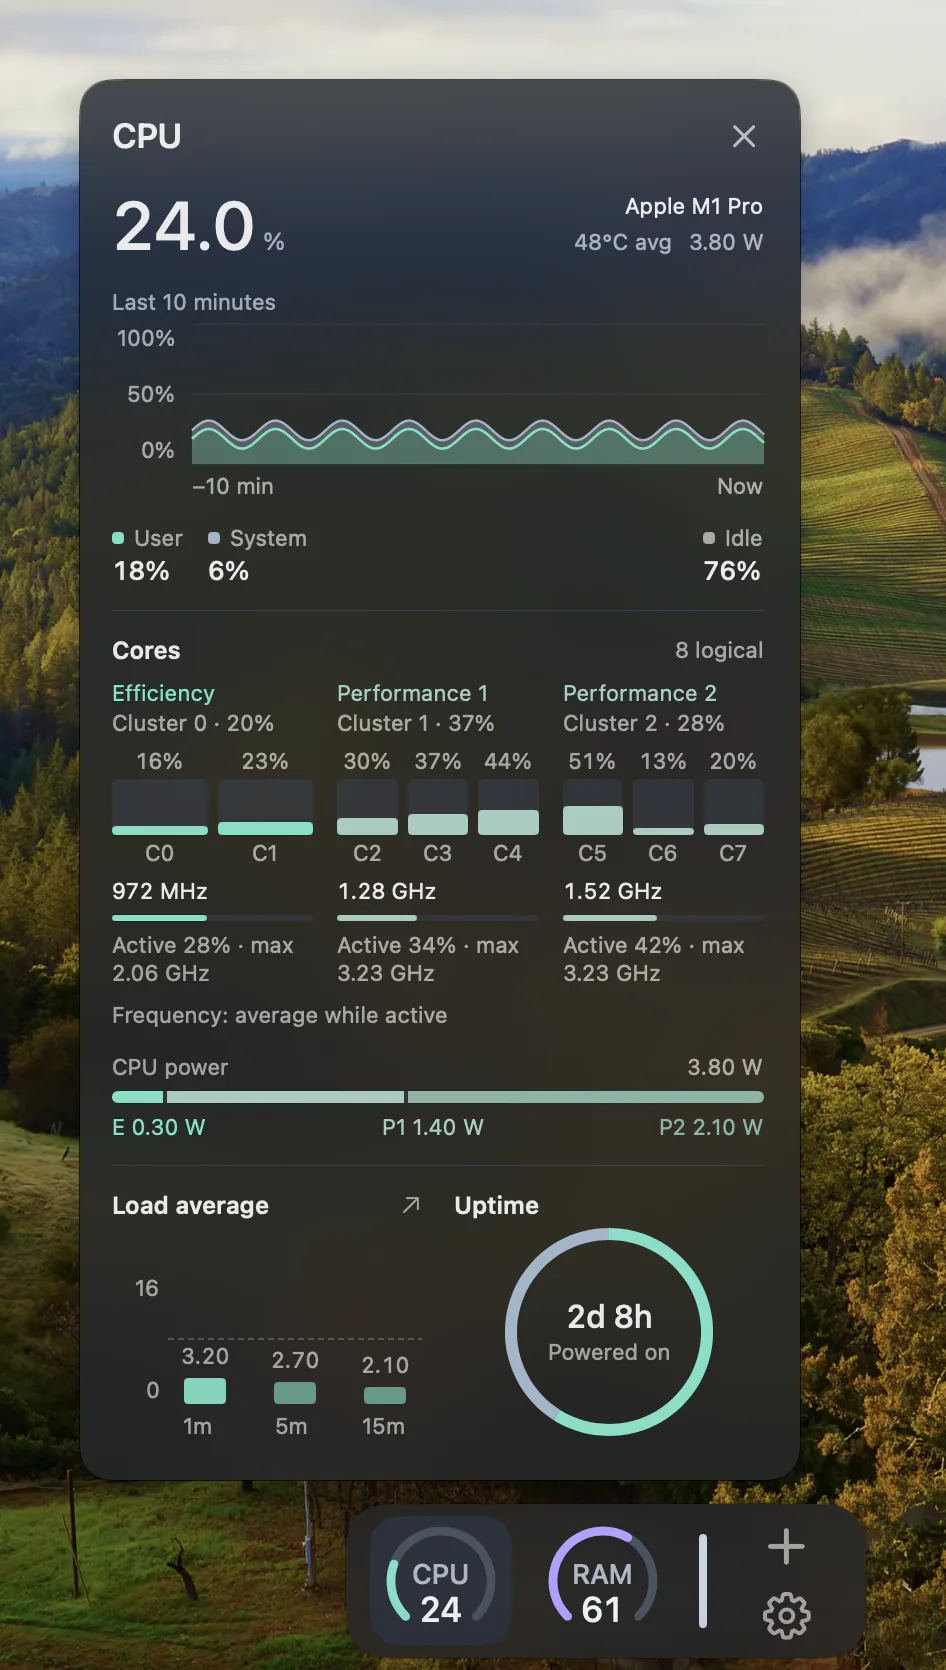
System is CPU activity used by macOS processes; User is activity used by your apps and their processes; Idle is unused capacity. Window → CPU History shows recent activity. Compare a sustained change with a brief spike before deciding what needs investigation.
Look beyond RAM percentage.
Select Memory and look at Memory Pressure at the bottom of the window. It reflects how efficiently memory is meeting current needs. Compressed is memory compressed to make room for active work; Cached Files can make repeated access faster; Swap Used is startup-disk space used for swapping data with RAM. A large Memory Used number alone does not diagnose a problem.
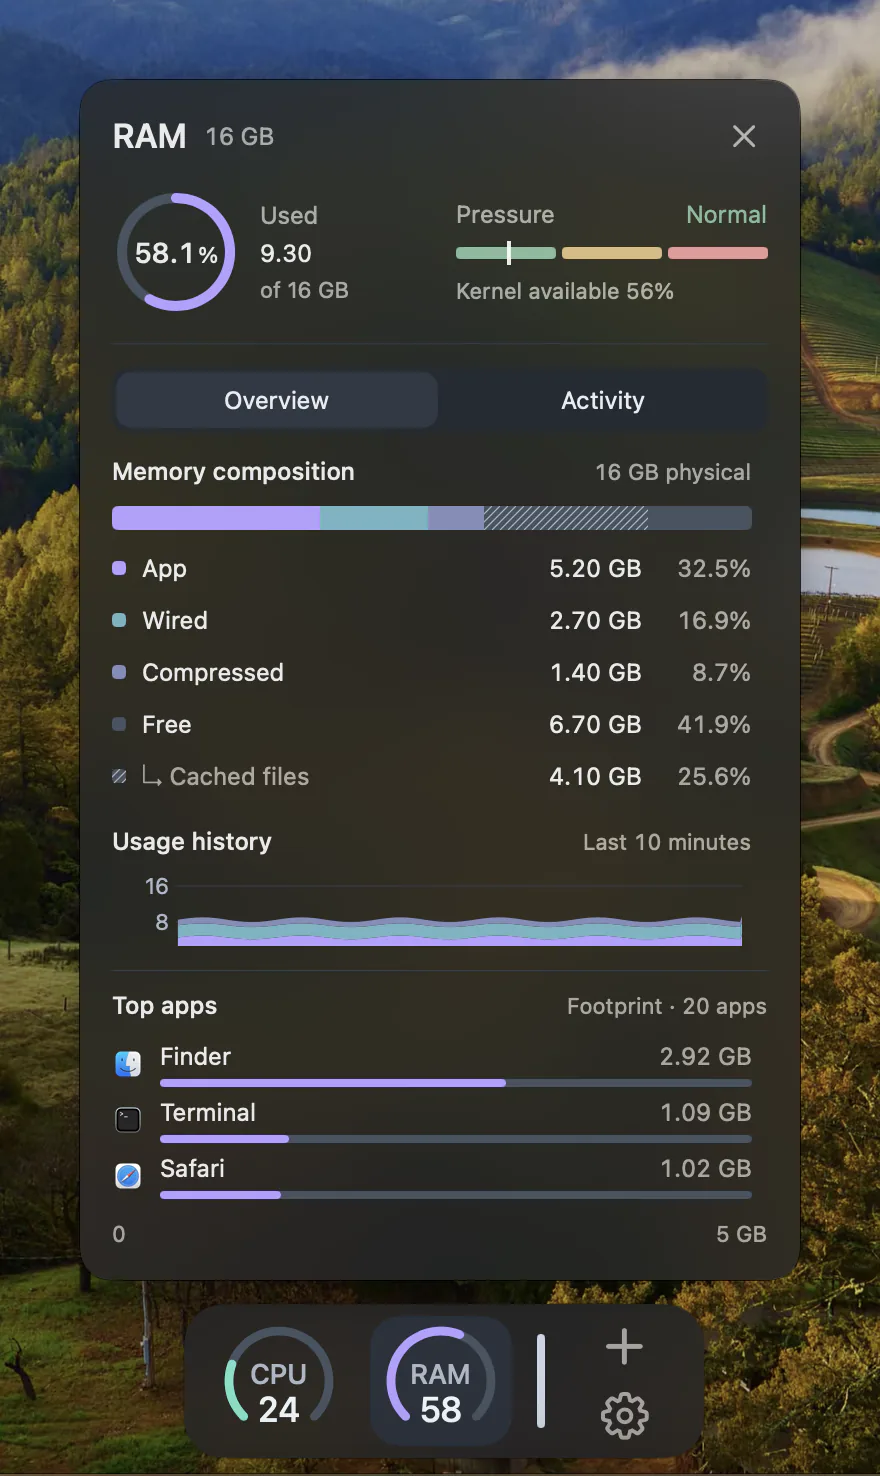
Compare with the work you feel.
If the Mac slows down, observe memory pressure and swap while you repeat the task. Save your work, quit an app you no longer need normally, then compare again. Avoid treating one snapshot as proof that an app is faulty or that the Mac needs more RAM.
Keep a compact reading nearby.
In Activity Monitor, choose View → Dock Icon and a CPU option for a graph in the Apple Dock. For CPU and RAM readings alongside other Widgets, explore DockMagic System Widgets. Return to Activity Monitor for detailed diagnosis. GPU and CPU-temperature availability depends on the Mac and supported sources.
Sources.
Apple documents CPU activity and memory usage. DockMagic’s small Widgets complement those detailed views.